In this article:
User-defined scripts are supported by ULogViewer 2.0+ and PixelViewer 2026.1+. Each script is defined for a specific purpose and will be executed when needed, for example, log analysis or image rendering. There are 3 scripting languages supported:
JavaScript
There is no need to take care of cancellation of running script because cancellation will be handled by JavaScript interpreter.
C# Script and Python
It is the responsibility of the script to check
CancellationToken (C#) /
is_cancellation_requested() (Python) periodically to abort the running script.
Syntax Error
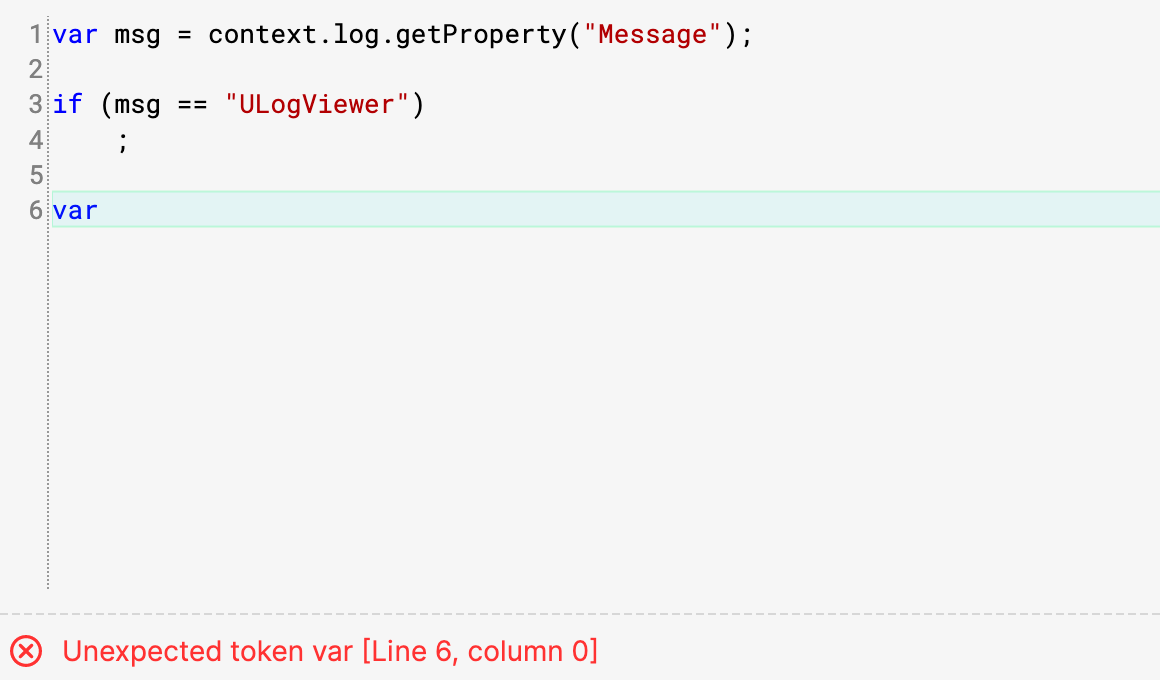
The syntax of the script will be checked during editing. Therefore, all syntax errors can be found in the script editing UI:
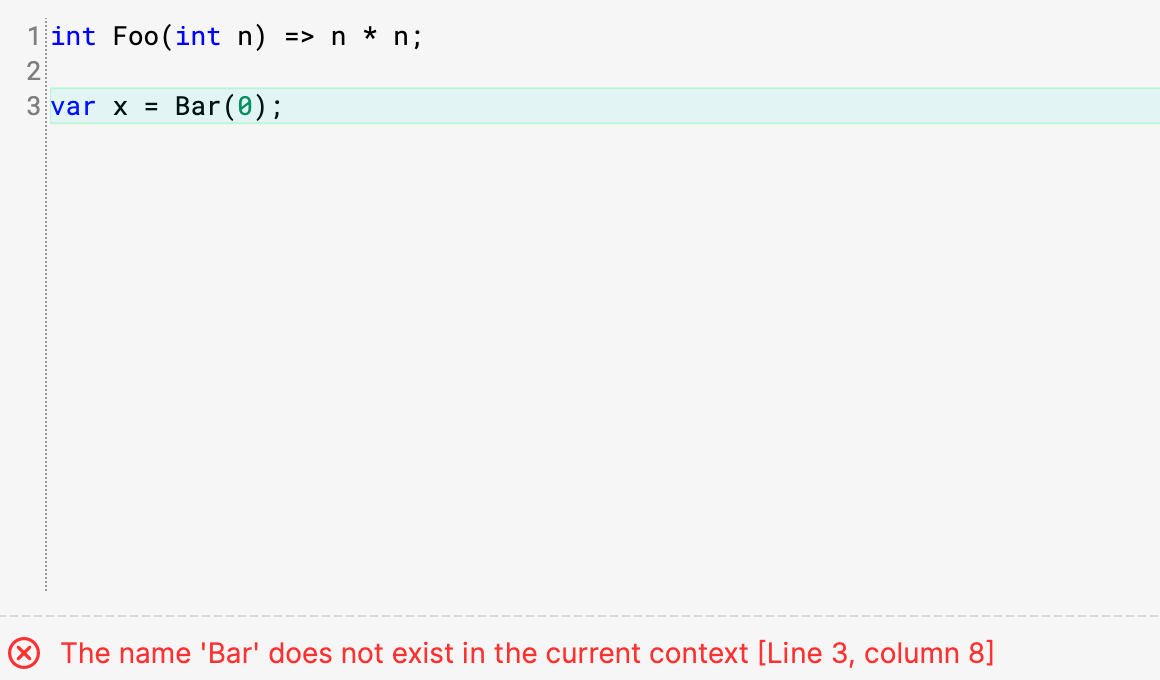
For C# scripts, incorrect references to identifiers can also be found while editing because C# scripts are compiled but JavaScript is not:
Runtime Error
An error dialog will appear when an error occurs while running a script. You can check the error message and the position of the source code that causes the error to find the root cause.
Sometimes the position of the source code that causes the error cannot be determined for C# scripts. In this case, you will need to do further debugging via logging.
Open Script Log Window in ULogViewer
Windows/Linux Users
- Click
 at right hand side of toolbar.
- Click 'Tools > Script Log Window' in menu.
macOS Users
- Click 'Tools > Script Log Window' in menu at top of screen.
Open Script Log Window in PixelViewer
- Open the image rendering script or the demosaicing script which you want to debug in the editor. Please refer to Image Rendering Script or Demosaicing Script for how to open the editor.
- Click [Script Log Window] in the editor.
View Real-time Logs in ULogViewer
- Open a new tab.
- Select "ULogViewer Real-time Log" log profile.
Error Logs
The following are examples of error logs in ULogViewer. You can find error log like this while running JavaScript in ULogViewer 3.0+:
Property 'getProperty_' of object is not a function [Line 1, column 0]
Before ULogViewer 3.0:
Error occurred while running analysis script of 'Test Script' (dkj1g2mf): [Line:1, Column:0] Property 'getProperty_' of object is not a function
For C# script, you can find error log like this in ULogViewer 3.0+:
Object reference not set to an instance of an object. [Line 1]
Before ULogViewer 3.0:
Error occurred while running setup script of 'Test Script' (dkj1g2mf): Object reference not set to an instance of an object.
The error message for C# scripts does not contain the position of the source code that causes the error before ULogViewer 3.0. Therefore, you may need to locate the error by logging from the script.
Logging is supported while executing a script. For usage of the logger, please refer to
Context.Logger for C# script /
context.logger for JavaScript /
log_*() global functions for Python.
The following log levels are supported, listed from highest priority to lowest:
- Critical
- Error
- Warning
- Information
- Debug
- Trace
In debug mode, logs of all levels will be written to the log buffer and file. Otherwise, only logs with level ≥
Debug will be written.
In addition to using the
Script Log Window to check real-time logs, you can also check the log file which is written by the application.
Checking Logs in ULogViewer
You can check real-time logs by opening a new tab and selecting the "
ULogViewer Real-time Log" log profile,
or check the log file by using the "
ULogViewer Log File" log profile to load "
Log/log.txt" in the root directory of ULogViewer.
Checking Logs in PixelViewer
Logs are written to "
Log/log.txt" inside the application data directory, which is the PixelViewer directory on
Windows and
Linux,
and "
~/Library/Application Support/CarinaStudio/PixelViewer/" on
macOS. You can open the file with any text editor, or load it into ULogViewer with the "
ULogViewer Log File" log profile.
The following are the types of script defined for a specific purpose in each application: